Climate Change - Global temperatures from satellite data
Global average lower tropospheric temperature anomaly for February, 2016 is +0.83 deg. C, up almost 0.3 deg C from the January value, +0.54 deg. C.
This is a new record for the warmest monthly anomaly* since satellite monitoring began in late 1978.
One piece of evidence that world temperatures are rising is that every La Nina ‘year’ since 1998 was warmer than every El Nino ‘year’ before 1995:

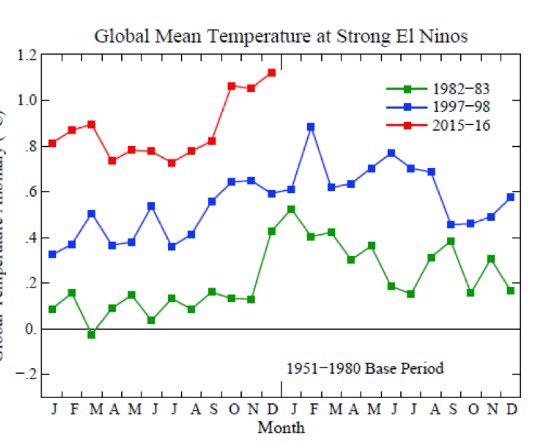
As the Earth warms, each El Nino 'rides' on a higher base-line global temperature:

The record-breaking temperatures of 2015 (and in 2016 so far) were partly boosted by an El Nino event ... but 2015 would have been the warmest year in the modern record even if there had been no El Nino.
* The term temperature anomaly means the change from a long-term average. A positive anomaly shows that the temperature was warmer than the average, while a negative anomaly indicates that the temperature was cooler than the average.
This is a new record for the warmest monthly anomaly* since satellite monitoring began in late 1978.
One piece of evidence that world temperatures are rising is that every La Nina ‘year’ since 1998 was warmer than every El Nino ‘year’ before 1995:
As the Earth warms, each El Nino 'rides' on a higher base-line global temperature:

The record-breaking temperatures of 2015 (and in 2016 so far) were partly boosted by an El Nino event ... but 2015 would have been the warmest year in the modern record even if there had been no El Nino.
* The term temperature anomaly means the change from a long-term average. A positive anomaly shows that the temperature was warmer than the average, while a negative anomaly indicates that the temperature was cooler than the average.