Climate Change - 2019 temperatures (and the most recent years)
Berkeley Earth, a non-profit research organization, has produced a report on global temperature changes based on data up to the end of 2019.
The last 5 years stand out as a period of significant warmth well above all previous years since 1850. This reflects the long-term trend towards global warming.


2019 was the second warmest year on Earth, in records starting in 1850.
The global mean temperature in 2019 was lower than 2016, but warmer than every other year that has been directly measured.
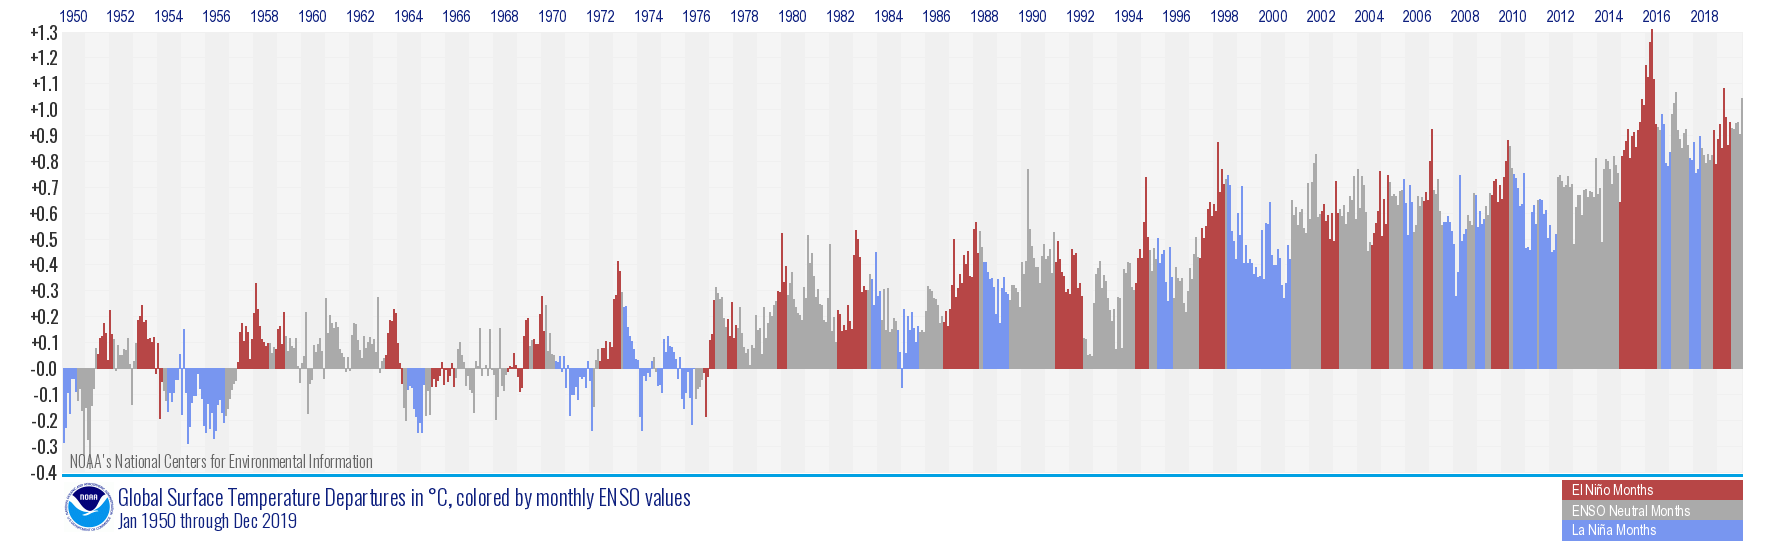
El Nino months are in red. La Nina months in blue. Neutral months in grey.
Both 2015 and 2016 were warmed by an extreme El Niño event that peaked in Nov/Dec of 2015 and was reported by NOAA as essentially tied for the strongest El Niño ever observed.
The exceptional El Niño boosted global mean temperatures in 2015 and 2016.
By contrast, 2019 began with a weak El Niño event and finished with neutral conditions.

Global mean temperature in 2019 was estimated to be 1.28 °C (2.31 °F) above the average temperature of the late 19th century, from 1850-1900, a period often used as a pre-industrial baseline for global temperature targets.
At the current rate of progression, the increase in Earth’s long-term average temperature will reach
1.5 °C (2.7 °F) above the 1850-1900 average by around 2035 and
2 °C (3.6 °F) will be reached around 2065.
Analysis and most graphics from Berkeley Earth.
The last 5 years stand out as a period of significant warmth well above all previous years since 1850. This reflects the long-term trend towards global warming.
2019 was the second warmest year on Earth, in records starting in 1850.
The global mean temperature in 2019 was lower than 2016, but warmer than every other year that has been directly measured.
El Nino months are in red. La Nina months in blue. Neutral months in grey.
Both 2015 and 2016 were warmed by an extreme El Niño event that peaked in Nov/Dec of 2015 and was reported by NOAA as essentially tied for the strongest El Niño ever observed.
The exceptional El Niño boosted global mean temperatures in 2015 and 2016.
By contrast, 2019 began with a weak El Niño event and finished with neutral conditions.
Global mean temperature in 2019 was estimated to be 1.28 °C (2.31 °F) above the average temperature of the late 19th century, from 1850-1900, a period often used as a pre-industrial baseline for global temperature targets.
At the current rate of progression, the increase in Earth’s long-term average temperature will reach
1.5 °C (2.7 °F) above the 1850-1900 average by around 2035 and
2 °C (3.6 °F) will be reached around 2065.
Analysis and most graphics from Berkeley Earth.


