Posts

Showing posts from March, 2023

CLIMATE WATCH - Arctic Sea Ice

Image
  From  https://nsidc.org/arcticseaicenews/ Arctic sea ice area changes with the seasons, but there is a long-term decline*, caused by global warming. Most scientific sources suggest there might be a few days of "ice-free" conditions in the Arctic Ocean one summer around mid-century. Ice-free sea (being darker) absorbs heat, while ice reflects heat. Progressively over time, more "ice-free" days are likely, on average.  But what exactly does an "ice-free Arctic Ocean" mean? For measurement purposes, researchers divide the ocean up into small cells. The data cells are 25 km by 25 km. If there is more than 15% ice on a cell, it counts as an "ice-covered" cell. If there is less than 15% ice on a cell, it counts as "ice-free". At some time, the Arctic Ocean one September will meet the 'ice-free' criterion - each cell will be counted as ice-free as long as there is less than 15% ice in the cell. But an 'ice-free' Arctic Ocean

CLIMATE WATCH - The IPCC Synthesis Report (2023, AR6)

Image
Useful graphics    From the following source, where there is plenty of additional material: https://www.wri.org/insights/2023-ipcc-ar6-synthesis-report-climate-change-findings Also:   https://www.theguardian.com/environment/2023/mar/20/humanity-at-climate-crossroads-highway-to-hell-or-a-livable-future IPCC links.....  (1) Press Release: https://www.ipcc.ch/report/ar6/syr/downloads/press/IPCC_AR6_SYR_PressRelease_en.pdf (2) Headline Statements: https://www.ipcc.ch/report/ar6/syr/resources/spm-headline-statements (3)  Slide-show: https://report.ipcc.ch/ar6syr/pdf/IPCC_AR6_SYR_SlideDeck.pdf?fbclid=IwAR1FD9sBJGgFBiDgC_ioAoM2t8qGqj4XktnYP4nwMY1IlLVNfGrxHPrF5Qw

CLIMATE WATCH - An Outline of the History of Climate Science

Image
1800-1870  Level of carbon dioxide gas (CO 2 ) in the atmosphere, as later measured in  ancient ice , was about 290 ppm (parts per million). Global temperature for 1850-1870 was about 13.6°C. 1824 Jean-Baptiste Joseph F ourier  calculated that the Earth would be far colder if it lacked an atmosphere.  1856 Eunice Foote   describes filling glass jars with water vapour, carbon dioxide and air, and comparing how much they heated up in the sun. “The highest effect of the sun’s rays I have found to be in carbonic acid gas,”    “The receiver containing the gas became itself much heated – very sensibly more so than the other – and on being removed, it was many times as long in cooling.” 1859 John Tyndall  discovered that some gases block infra-red radiation.  He suggested that  changes in the concentration of the gases  could bring  climate change . 1896  Arrhenius  published the first calculation of global warming from human emissions of CO 2 . 1930s  Milutin Milankovitch  proposed orbital c

CLIMATE WATCH - 1816 - The Year Without A Summer

Image
The climate can react to sudden shocks. The weather in  1816  was very strange.    Spring arrived, but then everything seemed to turn backward, as cold temperatures returned.   The sky seemed permanently overcast.  T he lack of sunlight became so  severe that farmers lost their crops.    Food shortages were reported in Ireland, France, England, and the United States. 1816 became known as  "The Year without a Summer"  or "18-hundred-and-frozen-to-death". It was over 100 years before anyone understood the reason for this weather disaster.    The eruption of an enormous volcano on a remote island in the Indian Ocean a year earlier had  thrown enormous amounts of volcanic ash  into the upper atmosphere. The dust from  Mount Tambora , which had erupted in early April 1815, had shrouded the globe.  With sunlight blocked, 1816 did not have a normal summer.   In Switzerland, the dismal summer of 1816 led to the writing of a famous story.  A group of writers, including Lord

CLIMATE WATCH - Carbon Burps in the Geological Record

Image
"Carbon Burps" ?? What are Carbon Burps? They are sudden releases of carbon from ancient rocks. They show up in the geological record as changes in geochemistry (so they are found by using fairly complex laboratory tests on rocks) They are associated with extinction events, but the scale of extinction varies a lot. The most extreme geological example of events like this is the end-Permian , when igneous activity broke through coal seams in Siberia. The interaction of hot magma and coal produced lots of CO2. The end-Permian event reduced oceanic biodiversity by about 92%. Recovery of biodiversity took about 10 million years - the fossil record from the next part of geological time, the early Triassic, is very thin. Messing with planetary systems isn't wise. One event with possibly closer similarities to what we are doing was about 56 million years ago, the Palaeocene-Eocene Thermal Maximum . The PETM mechanism (according to some good research) involved volcanic action bre

CLIMATE WATCH - The Greenhouse Effect

Image
What do scientists mean by the " Greenhouse Effect "? When the Sun's energy arrives at the Earth, it travels through the air. Some is reflected back to space, but some hits the Earth and warms it. The warm Earth gives off  infrared radiation  with various wavelengths.   Some of those waves can pass back out of the air to space, but some are absorbed by certain gases in the air. The gases then re-emit the energy into the air. If there are more of those gases, less heat escapes into space. An extreme case has happened on Venus. Concentrated  'greenhouse gases'  on Venus have caused the surface temperature to rise to 735  Kelvin  (462 degrees C; around 900 degrees F) Carbon dioxide levels in the atmosphere have risen quickly  since people began burning large quantities of fossil fuels. There was carbon dioxide in the air before that, at around 270 parts per million. Without any carbon dioxide, the Earth would be very cold. The temperature would be around -18 degrees

CLIMATE WATCH - The Long-Term Carbon Cycle

Image
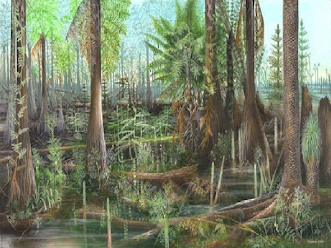
The formation of one typical coal seam took perhaps 100,000 years of photosynthesis by the first forests.  So much CO2 was removed from the air by the "coal forests" over millions of years in the Late Carboniferous that it caused an ice age (not the more recent one that most people know about) Such an intense ice age that it almost created a "Snowball Earth" around  300 million years ago: https://www.pnas.org/doi/10.1073/pnas.1712062114 Oil and gas were also produced hundreds of millions of years ago, and in their case the CO2 was taken up by tiny marine organisms in the oceans. Also over a huge amount of time. What about non-biological processes that remove CO2 from the air? These are also very slow. After the PETM warming event around 56 million years ago, it took around 20 million years for CO2 levels to fall sufficiently for glaciation to begin in Antarctica, at the Eocene-Oligocene transition. The CO2 was mainly taken up by weathering of the newly-rising Himala

CLIMATE WATCH - CO2 and climate sensitivity

Image
The effect of increasing CO2 is often described using a concept called "climate sensitivity".  (Sometimes "equilibrium climate sensitivity" ..... ECS) Climate sensitivity basically =   "how much does the temperature rise if we double the CO2?" For example - from this paper...... "Emergent constraint on equilibrium climate sensitivity from global temperature variability" - Cox et al, 2018 "2.2-3.4C, 2.8C with 66% confidence limits" So doubling CO2 from around 270 ppm (the pre-industrial value) to around 540 ppm would raise average global temperatures by around 2.8 C deg +/-0.6 C deg We are at about 420 ppm now. At the current increase in CO2, getting to around 540 ppm by the end of century is not impossible. The IPCC have looked at all the research on climate sensitivity, and their best estimate is that doubling CO2 produces a rise in average global temperature of 3 C degrees.  This is shown in this figure from IPCC AR6 WG1:      From  

CLIMATE WATCH - What's Causing Global Warming?

Image
If the climate changed before humans, how can we be sure that human activities are responsible for the warming that’s happening today?1 First, we can eliminate many of the factors that can cause global climate change. 1)   The sun has been  dimming slightly for the last half-century  while the Earth heats up, so global warming cannot be blamed on the sun. 2)  Volcanoes can produce CO2, but adding up all the CO2 produced by every volcano on Earth per year gives a number less than 1% of the CO2 produced by burning fossil fuels.       3) Orbital cycles that produce changes such as ice ages are currently in the wrong phases to account for the current warming, and the changes they cause happen over very long time periods , not a century or two. Scientists have carried out studies of all the possible "natural" causes.  None can account for the current warming.  However, CO2 has been known to have a property often called "The Greenhouse Effect" since the 19th century.   S

CLIMATE WATCH - The fossil fuel industry knew, decades ago

The oil industry’s pollution-control consultants advised the American Petroleum Institute in 1968 that carbon dioxide from burning fossil fuels was a serious issue. “Changes in temperature on the world-wide scale could cause major changes in the earth’s atmosphere over the next several hundred years including change in the polar ice caps.” https://insideclimatenews.org/news/13042016/climate-change-global-warming-oil-industry-radar-1960s-exxon-api-co2-fossil-fuels/ The fossil fuel industry owes huge amounts for compensation, and for lying about climate change for decades. The Exxon internal report, 1982, produced by their own scientists: https://www.documentcloud.org/documents/2805576-1982-Exxon-Memo-to-Management-About-CO2.html The key graph (it's on page 14 of the report): https://i.redd.it/ljifc828iui31.jpg Amazingly accurate for 1982, if you look at the projections for eg 2020 and beyond.

CLIMATE WATCH - Where are we headed?

Image
Where are we headed, climate-wise? It's now a choice of  difficult  outcomes or  very very difficult  (or add even more "verys" if the response is totally inadequate) Temperatures would stabilise "over a human lifetime" if CO2 levels stop rising. They don't decline quickly, but there is a very slow downward drift over a very long time. However,  all IPCC scenarios show 1.5 being overtaken at some point between around 2030 and 2040  - we've wasted too much time to do better than that - the "Denial Decades". Note that the stabilising of temperature implies EITHER all burning of fossil fuel stops, OR if some is still burned, every bit of CO2 produced is accounted for in a real process of sequestration. Stopping the rise in CO2 also begins to stabilise the water cycle, so rain etc doesn't get a lot worse (it'll be pretty bad by then) As for coastal areas - the Earth's ice masses are not even in equilibrium with the temperature we have n

CLIMATE WATCH - 24,000 Years

Image
A quick reminder of what global warming is about. 24,000-year graph of Earth temperatures: https://cdn.arstechnica.net/wp-content/uploads/2021/11/Screen-Shot-2021-11-09-at-6.48.24-PM-980x614.png Based on this paper https://www.nature.com/articles/s41586-021-03984-4 "Globally resolved surface temperatures since the Last Glacial Maximum" -Osman et al, 2021 This comes from careful palaeoclimatological research.

CLIMATE WATCH - Potential Futures for the Earth's Climate

Image
1) SSP1-1.9  — This scenario has been described as “ taking the green road .”  It’s the most ambitious and hardest-to-achieve storyline. It envisions a gradual but concerted shift toward clean energy, with few political barriers in adapting to and mitigating climate change.  This entails a rapid drawdown of fossil fuels, widespread deployment of clean energy, increasing energy efficiency, and lower resource demands. By the middle of the century, humanity will zero out its contributions to climate change. This scenario also assumes inclusive global development that lifts all countries. It imagines improvements in education and health that would help stabilize population growth, with the total declining slightly to 7 billion people. To create this future, humans would likely need to achieve a global philosophical shift away from the pursuit of economic growth and toward improvements in human well-being. While every scenario in the new IPCC report will likely overshoot the 1.5°C target, u