Global Temperature Change - A Geological Perspective

This graph shows how temperatures have changed over the last 11,000 years, since the end of the last glacial stage.
The graph uses data from modern temperature records, plus information about the past, from a research paper that combined data from over 70 different scientific studies.
The next graph adds data from even further back in time:
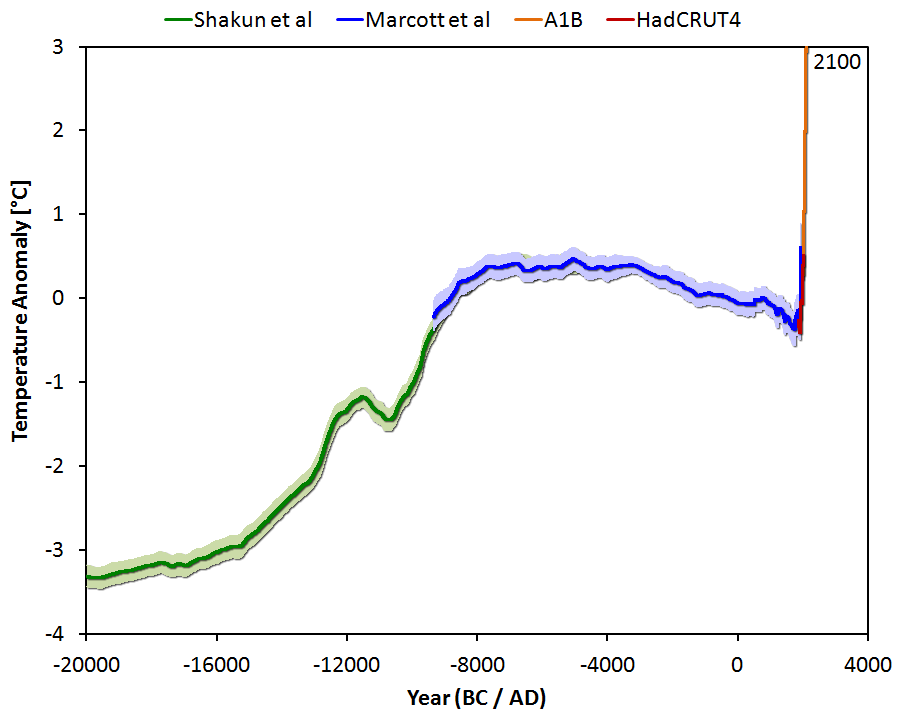
The green part covers the time as the last glacial stage was coming to an end, and the great ice sheets were melting.
The last glacial stage ended about 10,000 years ago.
Then, for nearly 5,000 years, global temperature was surprisingly stable.
In the next 5,000 years, up to about 1800, global temperature declined by about 0.7 deg.C.
There were some variations in that slow decline:
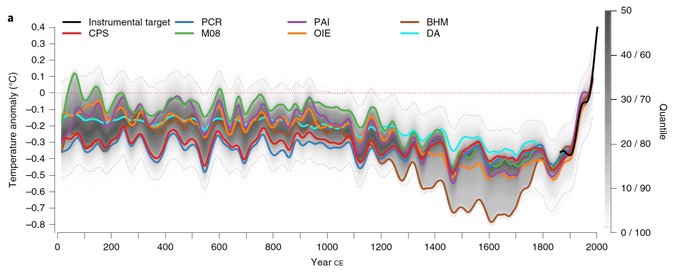
The Pages2K project has also reconstructed the temperature data for the same period:
There were some variations in that slow decline:
The Pages2K project has also reconstructed the temperature data for the same period:
From 1800 until 2000, temperature rose by about 0.8 deg.C, according to the World Meteorological Organisation.

This chart shows annual average global temperatures from 1950-2015 using data from NASA's Goddard Institute for Space Studies (GISS)

The next graph provides useful comparisons for various recent periods of time:

It is sometimes claimed that the raw data is changed in order to increased the apparent warming.
See here for more on this topic.
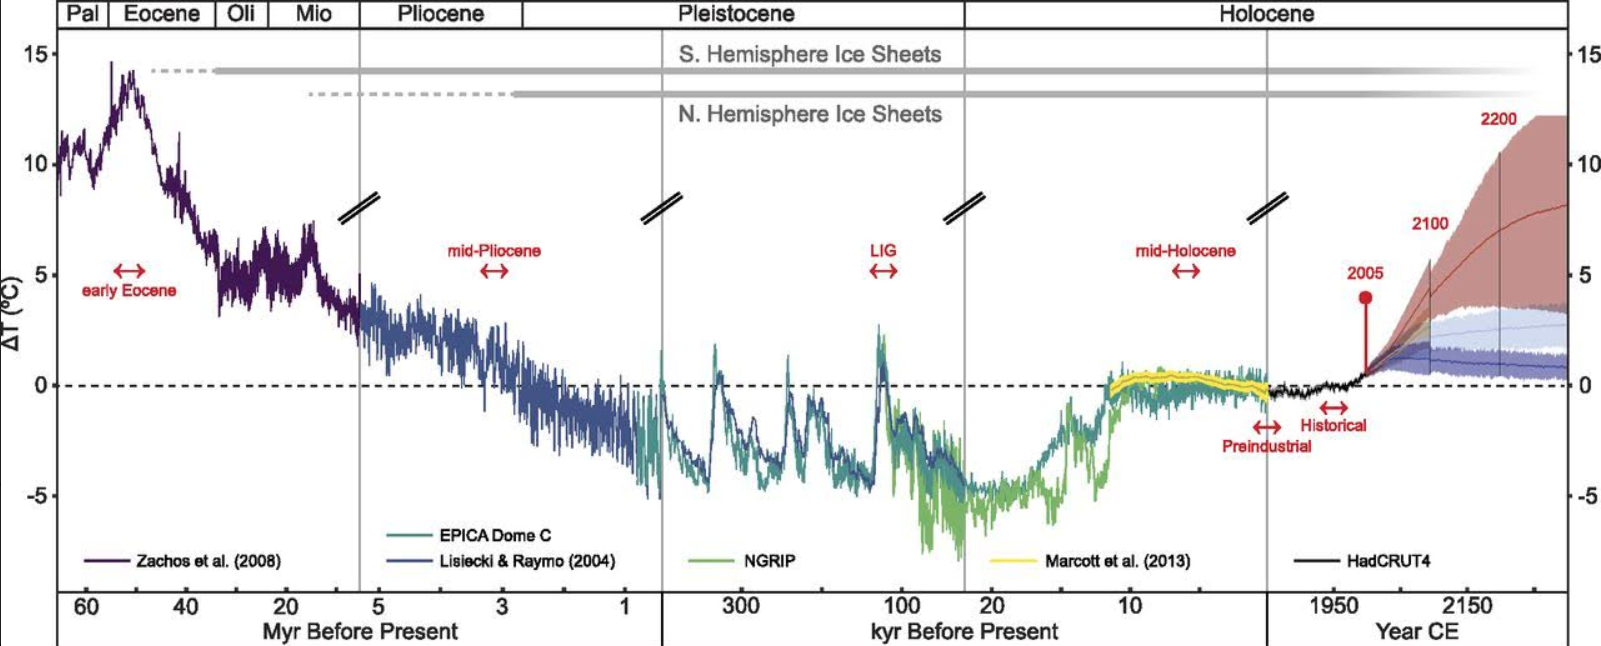
For a much longer perspective....
The next graph provides useful comparisons for various recent periods of time:
It is sometimes claimed that the raw data is changed in order to increased the apparent warming.
In fact, the raw data actually shows more warming than the adjusted data.
For a much longer perspective....


