Posts

CLIMATE WATCH - 24,000 Years

Image
A quick reminder of what global warming is about. 24,000-year graph of Earth temperatures: https://cdn.arstechnica.net/wp-content/uploads/2021/11/Screen-Shot-2021-11-09-at-6.48.24-PM-980x614.png Based on this paper https://www.nature.com/articles/s41586-021-03984-4 "Globally resolved surface temperatures since the Last Glacial Maximum" -Osman et al, 2021 This comes from careful palaeoclimatological research.

CLIMATE WATCH - Potential Futures for the Earth's Climate

Image
1) SSP1-1.9  — This scenario has been described as “ taking the green road .”  It’s the most ambitious and hardest-to-achieve storyline. It envisions a gradual but concerted shift toward clean energy, with few political barriers in adapting to and mitigating climate change.  This entails a rapid drawdown of fossil fuels, widespread deployment of clean energy, increasing energy efficiency, and lower resource demands. By the middle of the century, humanity will zero out its contributions to climate change. This scenario also assumes inclusive global development that lifts all countries. It imagines improvements in education and health that would help stabilize population growth, with the total declining slightly to 7 billion people. To create this future, humans would likely need to achieve a global philosophical shift away from the pursuit of economic growth and toward improvements in human well-being. While every scenario in the new IPCC report will likely overshoot the 1...

CLIMATE WATCH - The Keeling Curve - keeping track of atmospheric CO2

Image
Back in the 1950s, Charles Keeling took up a suggestion from his supervisor that it would be an interesting project for his PhD in chemistry to develop a way of measuring atmospheric CO2 concentration very accurately ...... he had no idea that he would find it rising year on year. Why the wiggle? The Keeling Curve has an annual cycle. Every year there is a decline in CO2 during months of terrestrial plant photosynthesis (basically northern summer) and an increase in CO2 in months without large amounts of photosynthesis and with significant decomposition - in both cases, it relates to the northern hemisphere, where there are more forests. https://keelingcurve.ucsd.edu/ https://celebrating200years.noaa.gov/datasets/mauna/welcome.html#1958

CLIMATE WATCH - How could so-called "climate sceptics" actually challenge the science of climate change?

I find Thomas Kuhn's analysis of how science proceeds is very useful - he describes science as a set of "paradigms" .  A scientific paradigm only begins to crumble if evidence accumulates that doesn't fit into it well, and this starts the process that Kuhn called "paradigm shift" . For a paradigm to change, researchers would have: (a) produced plenty of new research-based evidence that does not fit the paradigm, and  (b) offered an alternative paradigm that explains all the previous evidence plus the new evidence. Until both (a) and (b) take place, a paradigm stands. Plate tectonics came about in pretty much the way Kuhn describes - there were various older paradigms in geology, but progressively more and more evidence came along that did not fit into them.  By the mid 1960s there was enough evidence to create the new plate tectonic paradigm and the old paradigms vanished almost instantly. So where does AGW/climate science stand? Have those who wish to ch...

CLIMATE WATCH - PHYSICISTS PREDICT EARTH WILL BECOME A CHAOTIC WORLD

" ......in the worst cases, the researchers found that Earth's climate leads to chaos.............  A chaotic climate would have seasons that change wildly from decade to decade (or even year to year). Some years would experience sudden flashes of extreme weather, while others would be completely quiet. Even the average Earth temperature may fluctuate wildly, swinging from cooler to hotter periods in relatively short periods of time.........." https://www.livescience.com/humanity-turns-earth-chaotic-climate-system The paper:   https://arxiv.org/abs/2204.08955

CLIMATE WATCH - GLOBAL AVERAGE TEMPERATURE

Image
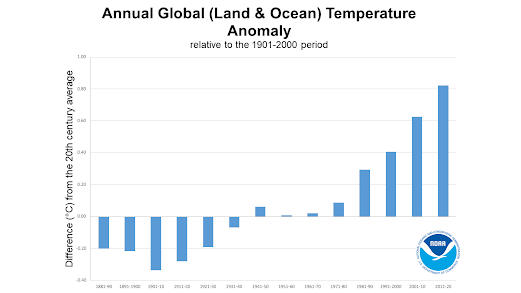
Global average temperature - a link about what global average temperature means, and some links to the data. https://www.carbonbrief.org/explainer-how-do-scientists... Decadal temperature anomalies (which means the difference between a given value and  a previous average) https://www.ncei.noaa.gov/.../decadal-global-temps-1881s... The 2022 report from Berkeley Earth *, one of the organisations that produces annual global temperature data: https://berkeleyearth.org/global-temperature-report-for.../ The UK Met Office 2022 report , which includes mention of the effect of the El Nino/La Nina cycle: https://www.metoffice.gov.uk/about-us/press-office/news/weather-and-climate/2023/2022-hadcrut5-wmo-temperature-statement   *Berkeley Earth came out of the endless complaints that the global temperature records had been "faked". Independent sceptical scientists set up a Berkeley Earth in 2010 to investigate the global temperature records. They found independent funding, including f...

CLIMATE WATCH - Climate Myths

A Climate Myth about CO2 and temperature We often see claims that "temperature always increases first, followed by a rise in CO2". The "sceptic" blogs quote this a lot, and the main error here is "always". This sequence ONLY happens at the end of glacial stages, at the very beginning of deglaciation. In other geological contexts, CO2 rises first.   But this one situation has become a key part of many "sceptic" comments. So what is going on? The initial warming as deglaciation starts is driven by astronomical cycles,  Milankovitch Cycles: https://www.youtube.com/watch?v=iA788usYNWA&t=193s Another https://www.youtube.com/watch?v=6lbJrvtxWNE (I don't often post videos in scientific comments, but to illustrate these cycles it's the obvious thing to do) This initial warming causes the oceans to release CO2.  Then the CO2 amplifies the warming. So rising temperature initially causes CO2 rise .... AND THEN THE INCREASE IN CO2 causes far mor...