Posts

CLIMATE WATCH - Arctic Sea Ice

Image
  From  https://nsidc.org/arcticseaicenews/ Arctic sea ice area changes with the seasons, but there is a long-term decline*, caused by global warming. Most scientific sources suggest there might be a few days of "ice-free" conditions in the Arctic Ocean one summer around mid-century. Ice-free sea (being darker) absorbs heat, while ice reflects heat. Progressively over time, more "ice-free" days are likely, on average.  But what exactly does an "ice-free Arctic Ocean" mean? For measurement purposes, researchers divide the ocean up into small cells. The data cells are 25 km by 25 km. If there is more than 15% ice on a cell, it counts as an "ice-covered" cell. If there is less than 15% ice on a cell, it counts as "ice-free". At some time, the Arctic Ocean one September will meet the 'ice-free' criterion - each cell will be counted as ice-free as long as there is less than 15% ice in the cell. But an 'ice-free' Arctic Ocean ...

CLIMATE WATCH - The IPCC Synthesis Report (2023, AR6)

Image
Useful graphics    From the following source, where there is plenty of additional material: https://www.wri.org/insights/2023-ipcc-ar6-synthesis-report-climate-change-findings Also:   https://www.theguardian.com/environment/2023/mar/20/humanity-at-climate-crossroads-highway-to-hell-or-a-livable-future IPCC links.....  (1) Press Release: https://www.ipcc.ch/report/ar6/syr/downloads/press/IPCC_AR6_SYR_PressRelease_en.pdf (2) Headline Statements: https://www.ipcc.ch/report/ar6/syr/resources/spm-headline-statements (3)  Slide-show: https://report.ipcc.ch/ar6syr/pdf/IPCC_AR6_SYR_SlideDeck.pdf?fbclid=IwAR1FD9sBJGgFBiDgC_ioAoM2t8qGqj4XktnYP4nwMY1IlLVNfGrxHPrF5Qw

CLIMATE WATCH - An Outline of the History of Climate Science

Image
1800-1870  Level of carbon dioxide gas (CO 2 ) in the atmosphere, as later measured in  ancient ice , was about 290 ppm (parts per million). Global temperature for 1850-1870 was about 13.6°C. 1824 Jean-Baptiste Joseph F ourier  calculated that the Earth would be far colder if it lacked an atmosphere.  1856 Eunice Foote   describes filling glass jars with water vapour, carbon dioxide and air, and comparing how much they heated up in the sun. “The highest effect of the sun’s rays I have found to be in carbonic acid gas,”    “The receiver containing the gas became itself much heated – very sensibly more so than the other – and on being removed, it was many times as long in cooling.” 1859 John Tyndall  discovered that some gases block infra-red radiation.  He suggested that  changes in the concentration of the gases  could bring  climate change . 1896  Arrhenius  published the first calculation of global warming from huma...

CLIMATE WATCH - 1816 - The Year Without A Summer

Image
The climate can react to sudden shocks. The weather in  1816  was very strange.    Spring arrived, but then everything seemed to turn backward, as cold temperatures returned.   The sky seemed permanently overcast.  T he lack of sunlight became so  severe that farmers lost their crops.    Food shortages were reported in Ireland, France, England, and the United States. 1816 became known as  "The Year without a Summer"  or "18-hundred-and-frozen-to-death". It was over 100 years before anyone understood the reason for this weather disaster.    The eruption of an enormous volcano on a remote island in the Indian Ocean a year earlier had  thrown enormous amounts of volcanic ash  into the upper atmosphere. The dust from  Mount Tambora , which had erupted in early April 1815, had shrouded the globe.  With sunlight blocked, 1816 did not have a normal summer.   In Switzerland, the dismal summer of ...

CLIMATE WATCH - Carbon Burps in the Geological Record

Image
"Carbon Burps" ?? What are Carbon Burps? They are sudden releases of carbon from ancient rocks. They show up in the geological record as changes in geochemistry (so they are found by using fairly complex laboratory tests on rocks) They are associated with extinction events, but the scale of extinction varies a lot. The most extreme geological example of events like this is the end-Permian , when igneous activity broke through coal seams in Siberia. The interaction of hot magma and coal produced lots of CO2. The end-Permian event reduced oceanic biodiversity by about 92%. Recovery of biodiversity took about 10 million years - the fossil record from the next part of geological time, the early Triassic, is very thin. Messing with planetary systems isn't wise. One event with possibly closer similarities to what we are doing was about 56 million years ago, the Palaeocene-Eocene Thermal Maximum . The PETM mechanism (according to some good research) involved volcanic action bre...

CLIMATE WATCH - The Greenhouse Effect

Image
What do scientists mean by the " Greenhouse Effect "? When the Sun's energy arrives at the Earth, it travels through the air. Some is reflected back to space, but some hits the Earth and warms it. The warm Earth gives off  infrared radiation  with various wavelengths.   Some of those waves can pass back out of the air to space, but some are absorbed by certain gases in the air. The gases then re-emit the energy into the air. If there are more of those gases, less heat escapes into space. An extreme case has happened on Venus. Concentrated  'greenhouse gases'  on Venus have caused the surface temperature to rise to 735  Kelvin  (462 degrees C; around 900 degrees F) Carbon dioxide levels in the atmosphere have risen quickly  since people began burning large quantities of fossil fuels. There was carbon dioxide in the air before that, at around 270 parts per million. Without any carbon dioxide, the Earth would be very cold. The temperature would be ar...

CLIMATE WATCH - The Long-Term Carbon Cycle

Image
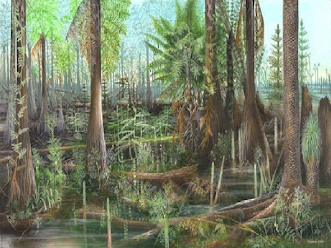
The formation of one typical coal seam took perhaps 100,000 years of photosynthesis by the first forests.  So much CO2 was removed from the air by the "coal forests" over millions of years in the Late Carboniferous that it caused an ice age (not the more recent one that most people know about) Such an intense ice age that it almost created a "Snowball Earth" around  300 million years ago: https://www.pnas.org/doi/10.1073/pnas.1712062114 Oil and gas were also produced hundreds of millions of years ago, and in their case the CO2 was taken up by tiny marine organisms in the oceans. Also over a huge amount of time. What about non-biological processes that remove CO2 from the air? These are also very slow. After the PETM warming event around 56 million years ago, it took around 20 million years for CO2 levels to fall sufficiently for glaciation to begin in Antarctica, at the Eocene-Oligocene transition. The CO2 was mainly taken up by weathering of the newly-rising Himala...