Carbon dioxide in the air - The Keeling Curve
Carbon dioxide levels in the atmosphere are rising.
This graph showing the data is called the Keeling Curve.
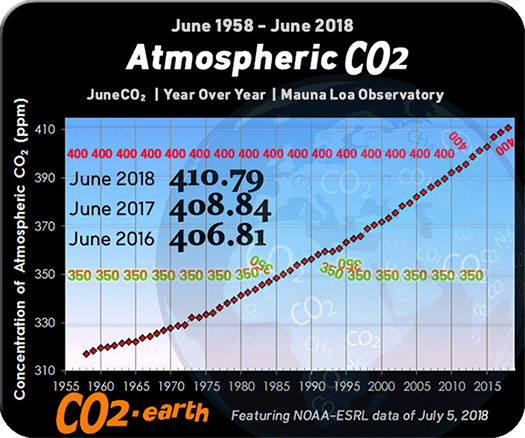
It is named after the scientist who first produced accurate measurements of carbon dioxide in the air - Charles David Keeling.
Keeling's data began in 1958.
What about carbon dioxide levels before 1958?
That information has been found by drilling into the ice in places like Antarctica and Greenland.
As layers of ice build up, they trap bubbles of air, which hold the evidence of the atmosphere from the year the layer was formed.
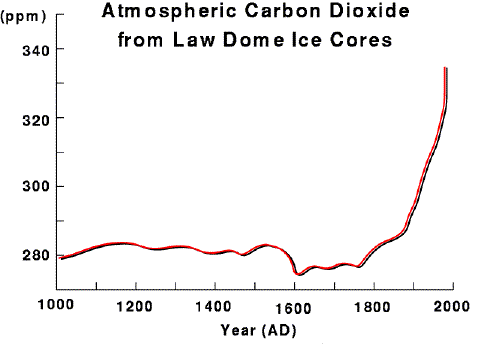
Law Dome is a location in Antarctica.
The evidence shows that since around the late 18th century, as the Industrial Revolution began, carbon dioxide levels have risen.
They had changed from around 280 parts per million to over 300 ppm when Keeling began his records in 1958.
Now it has reached around 400 ppm in just around 50 years.
This is a very fast rise, compared to the past.
This graph showing the data is called the Keeling Curve.
It is named after the scientist who first produced accurate measurements of carbon dioxide in the air - Charles David Keeling.
Keeling's data began in 1958.
What about carbon dioxide levels before 1958?
That information has been found by drilling into the ice in places like Antarctica and Greenland.
As layers of ice build up, they trap bubbles of air, which hold the evidence of the atmosphere from the year the layer was formed.
Law Dome is a location in Antarctica.
The evidence shows that since around the late 18th century, as the Industrial Revolution began, carbon dioxide levels have risen.
They had changed from around 280 parts per million to over 300 ppm when Keeling began his records in 1958.
Now it has reached around 400 ppm in just around 50 years.
This is a very fast rise, compared to the past.


