Posts

Showing posts from December, 2015

Interesting Scientists - William Smith

Image
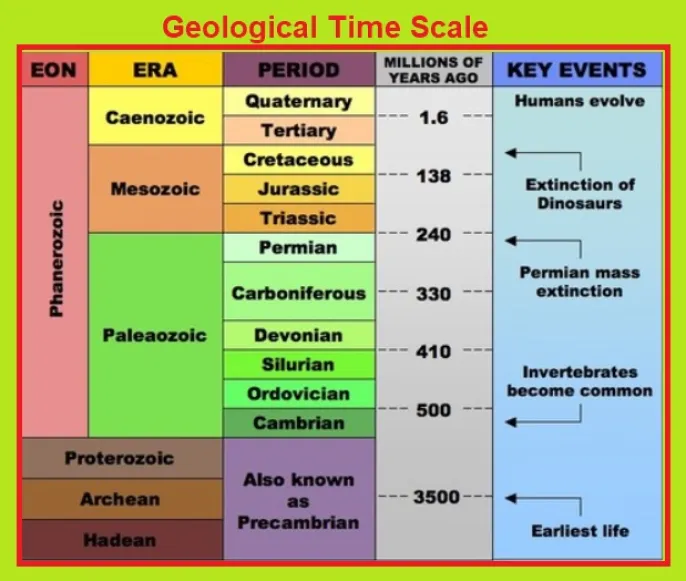
The  Geological Time Scale  outlines the history of the Earth. William Smith  was one of the first to explore geological time in an organised way. He had always been interested in fossils, but in 1794 he was employed to survey the route of a new canal. He saw that layers of rock lay at a slight angle on top of each other. This is an illustration Smith drew of fossils in a layer of clay he investigated near Bath. Each layer had its own set of fossils, distinct from the layers below and above  - this is now called the Principle of Faunal Succession . Here's how William Smith described his discovery: ". . . each stratum contained organized fossils peculiar to itself, and might, in cases otherwise doubtful, be recognised and discriminated from others like it, but in a different part of the series, by examination of them." This discovery was a key piece of scientific evidence that led towards Darwin's concept of evolution. Here is one diagram he drew of part o

Climate Change - The Greenhouse Effect

Image
What do scientists mean by the " Greenhouse Effect "? When the Sun's energy arrives at the Earth, it travels through the air. Some is reflected back to space, but some hits the Earth and warms it. The warm Earth gives off  infrared radiation  with various wavelengths.   Some of those waves can pass back out of the air to space, but some are absorbed by certain gases in the air. The gases then re-emit the energy into the air. If there are more of those gases, less heat escapes into space. An extreme case has happened on Venus. Concentrated  'greenhouse gases'  on Venus have caused the surface temperature to rise to 735  Kelvin  (462 degrees C; around 900 degrees F) Carbon dioxide levels in the atmosphere have risen quickly  since people began burning large quantities of fossil fuels. There was carbon dioxide in the air before that, at around 270 parts per million. Without any carbon dioxide, the Earth would be very c

Fossil footprints

Image
Footprints  of many kinds of creatures have survived as  fossils  in rocks. This can be because they were quickly covered by volcanic ash, or layers of fine clay, preserving the details. These footprints were most likely made by  Australopithecus afarensis , an early human whose fossils were found in the same sediment layer. They were found at Laetoli in Tanzania. The Smithsonian Museum has a wonderful site about footprints found at Laetoli. Looking at much older rocks, footprints of  dinosaurs  can be used to find out all sorts of things about their lives. There are plenty of dinosaur tracks in Texas, for example . Dinosaur footprints can make an   interesting educational activity.

Did Columbus prove the world was round? No, it's an Urban Myth

Image
The idea that Columbus proved the roundness of the Earth still appears from time to time. It's a myth. The Round Earth concept dates back thousands of years ... it was known in the time of the Ancient Greeks. The first person to measure the size of the Earth was  Eratosthenes. He lived from around  276 BC  to around  195/194 BC. So .... Columbus? He believed in a faulty size of the Earth, smaller than Eratosthenes had found. He thought it was not very far to India, Japan and China if he sailed across the Atlantic. This map gives an idea of how Columbus saw the situation. 'Cippangu' is Japan. If the 'New World' had not been there, his sailors would have starved.   When did the 'round earth' concept start? The Greek historian  Herodotus  wrote about an  Egyptian  sea voyage, which happened around 600 BC..... around 150 years before his own time. The fleet sailed South, down the Red Sea, and followed the coast of Africa - all the way to t

Climate Change - The Carbon Cycle

Image
Carbon dioxide is always in the atmosphere as part of the Earth's  carbon cycle. The global carbon cycle transfers carbon through the Earth’s different parts -  the atmosphere, oceans, soil, plants, and animals.  So carbon moves around — it flows — from place to place. Carbon dioxide (CO 2 ) is the main  greenhouse gas  emitted through human activities.  Human activities  change the carbon cycle. First, by adding more CO 2  to the atmosphere, mainly by  burning fossil fuels . Also by changing the ability of  natural sinks , like forests, to remove CO 2  from the atmosphere.  Human-related emissions are responsible for the increase that has occurred in the atmosphere since the industrial revolution.   The  carbon sinks,  on land and in the oceans, have responded by increasing the amount of carbon they absorb each year. Carbon sinks cope with  about half  of human greenhouse gas emissions.  The other half has accumulated in the atmosphere.

The Pole Star and the Two Bears

Image
In the Northern Hemisphere some of the stars of Ursa Major are easy to see on clear nights. They make a pattern sometimes called the Big Dipper or the Plough. Ursa Major and Ursa Minor are the 'Great Bear' and the 'Little Bear'. The two brightest stars of Ursa Major are known as the Pointers , because they point at the brightest star of Ursa Minor,  Polaris , the Pole Star. The Pole Star, or North Star, has always been used for navigation. Photographs show that as the Earth turns, Polaris is almost fixed in the centre of the turning star pattern. Like many stars , the stars of the Plough have Arabic names. One star, Mizar , is actually a  double star. Alcor probably orbits Mizar , taking around 750,000 years to complete one orbit. Some people with good eyesight can see Alcor and Mizar as two stars on a clear night. They can certainly be seen very easily with binoculars.

Orion the Hunter

Image
The constellation of Orion dominates the southern sky during winter in the Northern Hemisphere. The brightest stars of Orion have wonderful names. The Red Giant star Betelgeuse marks one shoulder, the other shoulder is marked by Bellatrix . The three Belt Stars (left to right) are Alnitak , Alnilam and Mintaka. The knees are marked by Saiph and the very bright Rigel . Like many star names, they are of Arabic origin . The stars of Orion act as signposts to other stars seen at the same time of year. Orion's stars are good examples of some of the wide variety of types of stars.   The Sun is really rather small compared to many stars

Climate Change - The Pliocene Rebooted?

Image
Atmospheric carbon dioxide concentration  is now around 400 parts per million (ppm). It last reached similar levels during the  Pliocene , 5.3-2.6 million years ago.   Outcrop of Middle Pliocene diatomaceous lake beds at Ledi Geraru, northern Afar region of Ethiopia. (photo: Roy Johnson.) In the middle Pliocene,  the concentration of carbon dioxide in the air ranged from about 380 to 450 parts per million.   During this period, the area around the North Pole was much warmer and wetter than it is now. Summer temperatures in the Arctic were around 15 degrees C , which is about 8 degrees C warmer than they are now. Global average temperatures were 2-3°C warmer than today. Sea level was up to 40 metres higher than now. Of course, there were no modern humans at that time. Hominids of the Pliocene Nor was there a  global system of food supply   relying on stable climates for agriculture.

Climate Change - Permafrost and greenhouse gases

Image
Arctic permafrost – ground that has been frozen for many thousands of years – is now thawing because of global climate change. “The release of greenhouse gases resulting from thawing Arctic permafrost could have catastrophic global consequences,” said  Dr. Max Holmes, a Senior Scientist at the Woods Hole Research Center (WHRC). Schematic diagram of  greenhouse gas es and permafrost.   Graphic by John Garrett. Thawing permafrost releases greenhouse gases (carbon dioxide and methane) into the atmosphere, which accelerate climate change, which in turn cause more thawing of the permafrost.  Some scientists fear that this potentially unstoppable and self-reinforcing cycle could produce a dangerous "tipping point".

Climate Change - 2015 global temperatures

Image
The US National Oceanic and Atmospheric Administration (NOAA) has released a chart that illustrates how warm 2015 is, compared to the six other warmest years on record.  2015 is running away with the title of 'warmest year'.  The reason is a combination of global warming , and a strong El Nino  event in the Pacific Ocean. NOAA also released a comparison to all the years back to 1880 , which is when the modern temperature record began. It's also useful to look at years one by one in another way, colour-coded for El Nino, La Nina and 'neutral' years: Every La Nina year since 1998 was warmer than every El Nino year before 1995. Note that 2015 has not yet been added to that chart.

Winter solstice

Image
Summer in the south, winter in the north. Seasons are caused by the tilt in the Earth's axis. Winter Solstice is the time of the longest night and shortest day. Many ancient monuments are lined up with the solstice, which suggests it was an important moment of the year for many cultures. One is  Maeshowe  on Orkney. Others include  Stonehenge  and  Newgrange . Winter solstice sunset at Stonehenge in the mid-1980s. Image via Wikimedia Commons.

Climate Change - Global temperature information for November 2015

Image
The combined average temperature over global land and ocean surfaces for November 2015 was the highest for November in the 136-year period of record, according to the US National Oceanic and Atmospheric Administration . The temperature was 0.97°C (1.75°F) above the 20 th  century average of 12.9°C (55.2°F), breaking the previous record of 2013 by 0.15°C (0.27°F).  This marks the seventh consecutive month that a monthly global temperature record has been broken.  September, October and November together make up Northern Hemisphere Autumn, and Southern Hemisphere Spring. The September–November seasonal temperature was 0.96°C (1.73°F) above the 20 th  century average of 14.0°C (57.1°F).  This marks the highest departure from average for the season in the 136-year period of record, surpassing the previous record set last year by 0.21°C (0.38°F).

Climate Change - Oceania

Image
An international team of researchers  has produced this graph of ocean levels, for a period of time going back to around 500 BC.  Oceania  is a region made up of thousands of  islands throughout the Central and South  Pacific Ocean.   It includes Australia, the smallest continent in terms of total land area. Many of the nations in Oceania are  Small Island Developing States (SIDS). Many scientists say that Oceania is more vulnerable than most parts of the Earth to climate change, because of its climate and geography.  The heavily coastal populations of the continent’s small islands are vulnerable to flooding and erosion  because of  sea level rise.   Fiji’s  shoreline has been receding about 15 centimetres per year over the last 90 years. Samoa  has lost about half a metre per year during that same time span.  The global sea level graph is from this paper:  "Temperature-driven global sea-level variability"

Climate Change - Why isn't every year a record year?

Image
Heat can affect things without causing a temperature rise. Extra heat can be used in ‘ changing state ’ instead of raising temperature. A change of state could be … a  solid  melting to a  liquid .  Or a  liquid  evaporating to a  gas . So  heat is needed to change ice at zero degrees C to water at zero degrees C. And to change water into water vapour….. without raising the temperature. Scientists call the heat used to change state  latent heat. Also, there are natural variations in the global climate,  El Nino  events being the ones that affect world temperature the most. The opposite to 'El Nino' is 'La Nina', a cooling effect. If global temperatures are plotted on a graph in a way that shows these variations, it makes the overall warming trend very obvious. Every La Nina year since 1998 has been warmer than every El Nino year before 1995.

Climate Change - Deltas at risk

Image
Deltas  often form when rivers reach the sea. The river can carry sand and mud when it is flowing fast. As the water enters the sea, it s lows down , and the sediment drops to make the delta. Many deltas are at risk from climate change.   This map shows the levels of risk. An estimated 80 percent of the world's megacities are located in fragile river deltas.   A megacity has a population of over 10 million people. Over 500 million people live on deltas. Why are deltas at risk? One reason  is  rising sea level , which wears away the delta from the front. Deltas are an example of the complex processes that happen along coastlines.

The Earth from Space

Image
The Chinese spaceprobe  Chang'e 5  took this photograph from space in October 2014. The spaceprobe was beyond the Moon, looking back at Earth. This photograph was taken by the  Cassini  spaceprobe, which is in orbit around Saturn. The dot marked with an arrow is  Earth . To see the Earth turning in space is amazing - click here for a video. Finally, an image taken by the  NEAR spaceprobe  - the Earth and Moon.

Climate Change - The Warmest Winter

Image
The  northern hemisphere  winter  , December 2014 to February 2015, was the warmest in the records,  according to NASA. The average temperature, taken for northern land and ocean surfaces, was  0.79°C above the 20 th   century average.  This was the highest for December, January and February in the 1880–2015 record, passing the previous record of 2007 by 0.03°C. It is interesting to note that there were some 'cold spots'. Eastern North America was colder than average, and there is an obvious 'blue blob' in the North Atlantic. In 2015,  Boston ’s month of snow was a  1-in-26,315 year occurrence.

Climate Change - The 8,200 year event

Image
When the last glacial period ended about 11,500 years ago, the Earth's modern climate began to develop.  The large continental ice sheets shrank, and sea level rose. Around 8,200 years ago, however, a major cooling event occurred.  The   8.2 ka event   was first discovered in the Greenland ice core  GISP2. Over two decades temperature cooled about 3.3°C in Greenland . Temperatures in Europe dropped by around 2 °C. The entire event lasted about 150 years. Then temperatures warmed, returning to their previous levels.  So what caused the 8.2 ka event? As the large ice sheets in Canada were melting, a large  meltwater lake  formed south of the Hudson Bay.   Geologists have named this  Lake Agassiz , after the  19th century scientist Louis Agassiz. It was dammed to the north by the  Laurentide  ice sheet . Slowly, the ice melted further, and the lake emptied into the sea in a very short period of time. The release of the water fro

Climate Change - The Atmosphere

Image
Space is not very far away. Aircraft on long-haul flights travel at a height of about 10 km. The lowest layer of the atmosphere, the  Troposphere,  ends at about 15 km. The air in the layers above the troposphere is very thin indeed. Think of a place around 15 km (9 miles) from where you are. That's pretty much how near you are to space. All the waste gases people dump into the air are trapped in the thin layer of air around the Earth. Molecules  in the air include nitrogen and oxygen as well as water, carbon dioxide, ozone, and many other compounds in trace amounts, some created naturally, others the result of human activity. In addition to gases, the atmosphere contains extras such as smoke, dust, acid droplets, and pollen. Atmospheric concentrations  of some  greenhouse gases  over the last 2,000 years.  Increases since about 1750 are due to human activities in the industrial era.  Concentration units are  parts per million (ppm)  or  parts per billion (ppb)