Posts

Showing posts from July, 2015

Climate Change - "The climate has always changed .......what is all the fuss about?"

Image
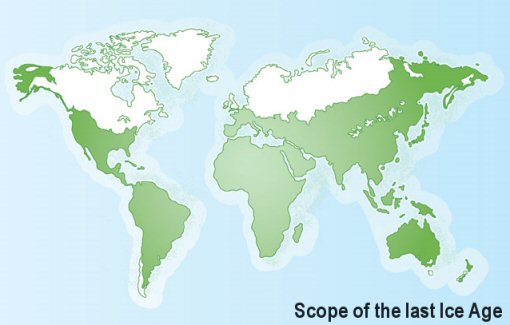
The climate has changed before. When people say "It's changed before without people, so people can't be involved this time" ....think of  forest fires . Fires happened throughout time, does that mean people can't start fires? Ice ages, warm times ... the geological record in the rocks shows many events. Even so,  the current changes are very unusual . Note that in the "Years before present" scale, zero = 1950 AD Graph based on a paper  published in 2013 The recent rise in temperature is very fast. What other kinds of changes are happening? Geologists   have compared the past with the present. This report - Climate Change Evidence: The Geological Society of London explains what they have discovered. This is based on part of that report: "Before the current warming trend began, temperatures were declining. This cooling took Earth’s climate into the ‘Little Ice Age’ (1450 – 1850).  Calculations indi

Climate Change - 2015 temperatures

Image
The Earth is going through an extraordinary process.... the planet is warming, the ice is melting, and the climate is changing. There hasn't been a  new coldest year  for over 100 years, as you'll see if you click here and watch the video In  2015 , the  warming trend  continued. The year  2015  ranks as Earth’s warmest year since records began in 1880. This is reported by scientists from NASA and the National Oceanic and Atmospheric Administration.   The average surface temperature has risen  about 1.0 degree Celsius  since the late-19th century. Globally-averaged temperatures in 2015 beat the previous record set in 2014 by  0.13 degrees Celsius .  NASA analysis estimates 2015 was the warmest year with 94% certainty. Most of the warming occurred in the past 35 years, with 15 of the 16 warmest years on record occurring since 2001. 2015 was the first time the global average temperature was 1 degree Celsius or more above the 1880-1899 average. Glob

Climate Change - Greenland

Image
The invention of the name  Greenland  may mark the start of the advertising industry. A  saga  tells how  Erik the Red , the Icelandic Viking who wanted to get people to join his planned settlement, called it Greenland because a pleasant name would attract more settlers: He called the land which he had found Greenland, because, quoth he, "people will be attracted thither, if the land has a good name."  The  ice sheet  on Greenland covers most of this huge island. Greenland is losing ice, and the mass of ice lost is measured by satellites called GRACE. A survey of Greenland's glaciers  has shown they are speeding up. The speed has increased by about 30% in 10 years. A new NASA project called  Oceans Melting Greenland (OMG)   will observe changing water temperatures on the continental shelf surrounding Greenland, and how marine glaciers react to the presence of warm, salty Atlantic water. Updates about Greenland's ice sheet are regularly posted by the

Climate Change - The link with mass extinctions

Image
What is the worst-case scenario for climate change? The geological record shows that when the atmosphere suddenly changes, there are big effects on living things. Five major  mass extinction  events are recorded in the rock record of the last 600 million years. The biggest extinction was at the end of the  Permian , around 252 million years ago. It is called the  End-Permian mass extinction. Only about 8% of species survived to live on in the Triassic Period. This photo shows geologists investigating tilted sedimentary rocks at Shangsi in South China. Triassic rocks (at the top right) lie over the older Permian rocks. Each mass extinction in the rocks matches with a change in the chemistry of the rocks called a ' carbon excursion '. Some of the carbon excursions are 'negative CEs' and some are 'positive CEs'. Negative CEs  indicate that lots of gaseous carbon compounds escaped into the air, causing warming. These are sometime

Climate Change - What share of warming is caused by human activity, and what is the risk?

Image
Scientists at the  Geological Society of London  say - All the current rise in temperature is caused by human activity. Here is the key part of the statement from GeolSoc: Before the current warming trend began, temperatures in the Holocene (the last 11,000 years) were declining .   Astronomical calculations indicate that this period of low insolation and associated cool conditions should continue for about another 1,000 years.   Nevertheless, after 1900 the overall decline in temperature sharply reversed.   There is now greater confidence than in 2010 that the only plausible explanation for the rate and extent of temperature increase since 1900 is the exponential rise in CO2 and other greenhouse gases in the atmosphere since the Industrial Revolution. How can has this be proved? The key is found in looking at the evidence of the Ice Age. The 'Ice Age' is actually a long set of colder (glacial) stages and warmer (interglacial) stages. The last major

Climate Change - Iceland

Image
Iceland lies on the  Mid-Atlantic Ridge , which is why it has volcanic activity. Iceland also has  ice caps  and  glaciers . Iceland is one of the fastest-warming places on the planet  – as much as four times the Northern Hemisphere average.  The glaciers that cover more than 10 percent of the island are losing an average of 11 billion tons of ice a year.                 Iceland glacial meltwater - photo Tom Harding The water melting from Iceland's glaciers would fill 50 of the world's largest trucks every minute. Parts of Iceland are rising as the ice caps melt,  reducing the weight on the Earth's crust. The thinning of the ice caps reduces the pressure on the rocks. Geologists know lower pressure from above makes volcanoes erupt more easily. Lower pressure allows volcanic gases to expand, and mantle rocks melt more easily at lower pressure as well. So more magma can rise into the volcanic systems. As that happens, Iceland's volcanoes may get mo

Climate Change - Farming, food & possible mass migrations

Image
Farmers can put up with some bad weather, but  climate change  will make unusual events more likely. 20-30% of plant and animal species will be more likely to become extinct if the temperature rises by more than 1.5-2.5C. There will be big effects on farming from droughts and floods. The biggest effects will be seen first near the  Equator . Just  being near the Equator  makes it more difficult for countries to make economic progress. Hotter conditions affect how crops grow. Our agriculture is heavily reliant on  grasses  from the temperate regions. Corn, wheat, and rice  are all types of grass. The Tropics will expand as the world warms, so the world will find it harder to grow those important crops. People will  try to leave places  where they cannot produce enough food. Countries where  food prices  rise rapidly tend to become unstable, making  conflicts  more likely. Global warming affects wheat production. A rise of 2 degree C in tempe

Climate Change - Early steps in Climate Science

Image
Some key events in the discovery of climate change 1800-1870  Level of carbon dioxide gas (CO 2 ) in the atmosphere, as later measured in  ancient ice , was about 290 ppm (parts per million). Global temperature for 1850-1870 was about 13.6°C. 1824 Jean-Baptiste Joseph F ourier  calculated that the Earth would be far colder if it lacked an atmosphere.  1859 John Tyndall  discovered that some gases block infrared radiation.  He suggested that  changes in the concentration of the gases  could bring  climate change . 1896  Arrhenius  published first calculation of global warming from human emissions of CO 2 . 1930s  Milutin Milankovitch  proposed orbital changes as the cause of ice ages.  1938  Guy Callendar  showed that  global warming was underwa y,  reviving interest in the question.  1950s  By accident,  Russell Coope  discovered that some past climate change events happened in  just a few decades . This came from  his research into

Climate Change - How the great ice sheets are melting

Image
An ice sheet  is a mass of glacial land ice extending more than 50,000 square kilometres.  An ice cap  is an area of land ice smaller than an ice sheet. The two ice sheets on Earth today cover most of Greenland  and Antarctica . An example of an ice cap is  Iceland ’s Vatnajökull. The ice sheets are now losing ice at the unprecedented rate of 500 cubic kilometres a year.  Scientists from the Alfred Wegener Institute (AWI) in Bremerhaven  mapped changes in the height of the Greenland and Antarctic ice sheets. They have found they are melting at record pace.  “Since 2009, the volume loss in Greenland has increased by a factor of about 2, and in the West Antarctic Ice Sheet by a factor of 3,”  says  glaciologist Professor Dr. Angelika Humbert, one of the study’s authors. A new NASA project called  Oceans Melting Greenland (OMG)   will observe changing water temperatures on the continental shelf surrounding Greenland, and how marine glaciers react to the presence o

Climate Change - Volcanoes

Image
Many people think  volcanoes  produce more carbon dioxide than humans. In fact, volcanoes produce far less carbon dioxide than humans. Geologists have checked this problem very carefully. This chart compares the average yearly production of carbon dioxide by human activities and volcanoes...... This information comes from the United States Geological Survey. Volcanoes would need a year to produce as much CO2 as human activity now produces in a few days . Not bad for a load of little mammals. Very large volcanic eruptions do affect global temperatures for a year or two. The second-largest volcanic eruption of the 20th century occurred at  Mount Pinatubo in the Philippines  on June 15, 1991. The volcano exploded in a cataclysmic eruption that ejected more than 5 cubic kilometres of material.  The ash cloud from this eruption rose 35 kilometres into the air. Nearly 20 million tons of sulphur dioxide were injected into the stratosphere in Pinatubo's 1991 e

Climate Change - Antarctica

Image
Some people say "The ice sheets in Antarctica are growing". This is very misleading. First, the Antarctic has ice on land and in the sea. Antarctica  is a continent covered by ice, unlike the ocean in the Arctic. The  sea ice  surrounding Antarctica melts almost to the coast each summer. The winter sea ice has increased by around 1% over the last few decades. This is due to complex processes. It is linked to  melting of the  land ice  on Antarctica ….. Antarctica is losing  very large amounts of ice  from its ice sheets and glaciers. The graph is from data collected by the  GRACE satellites. Here is an outline  of what is happening in the seas around Antarctica...... Seawater does not freeze until around minus 2 degrees C because it is salty. This effect of salt, of course, is used to help defrost roads. The meltwater off Antarctica’s ice sheets is freshwater. Freshwater has a low density, so it forms a layer on top of the sea. Fresh

Climate Change - The long-lasting effects on sea life

Image
A  new study  reports that  ocean life can take thousands of years  to recover  fro m climate change. The team, led by  Dr Sarah Moffitt,  examined more than 5,400 fossils, from sea urchins to clams, found in a 30 metre sediment core from the ocean floor off Santa Barbara, California. The tube-like sediment core is a slice of ocean life as it existed between 3,400 and 16,100 years ago. An example of an ocean sediment core. It provides a snapshot of what happened during the  last major deglaciation. It was a time of abrupt climate warming, melting polar ice caps, and expansion of low oxygen zones in the ocean. The sediment core revealed a history of a well-oxygenated sea-floor full of life. Then there was a period of oxygen loss and warming, that triggered a rapid collapse of life. A typical view of the ocean floor The study shows that the fossils nearly vanish in layers formed when oxygen levels in the sea dropped. In periods of less than 100 years, ocean oxygen le